
Commodity markets often respond strongly to supply disruptions, economic activity, and geopolitical developments. Yet many traders still rely heavily on chart analysis to interpret price behavior. Learning commodities trading strategies allows traders to observe patterns that frequently appear across energy, metals, and agricultural markets.
Unlike fundamental analysis, which studies production and consumption data, technical analysis focuses entirely on price movement. Traders attempt to identify trends, momentum shifts, and areas where buying or selling pressure may increase.
Continue reading to see how chart analysis is commonly used when trading commodities.
Why Technical Analysis Is Useful In Commodity Markets
Commodities can be extremely reactive to news. Because of that, traders often monitor charts to detect early signals of changing sentiment before fundamental reports confirm the move.
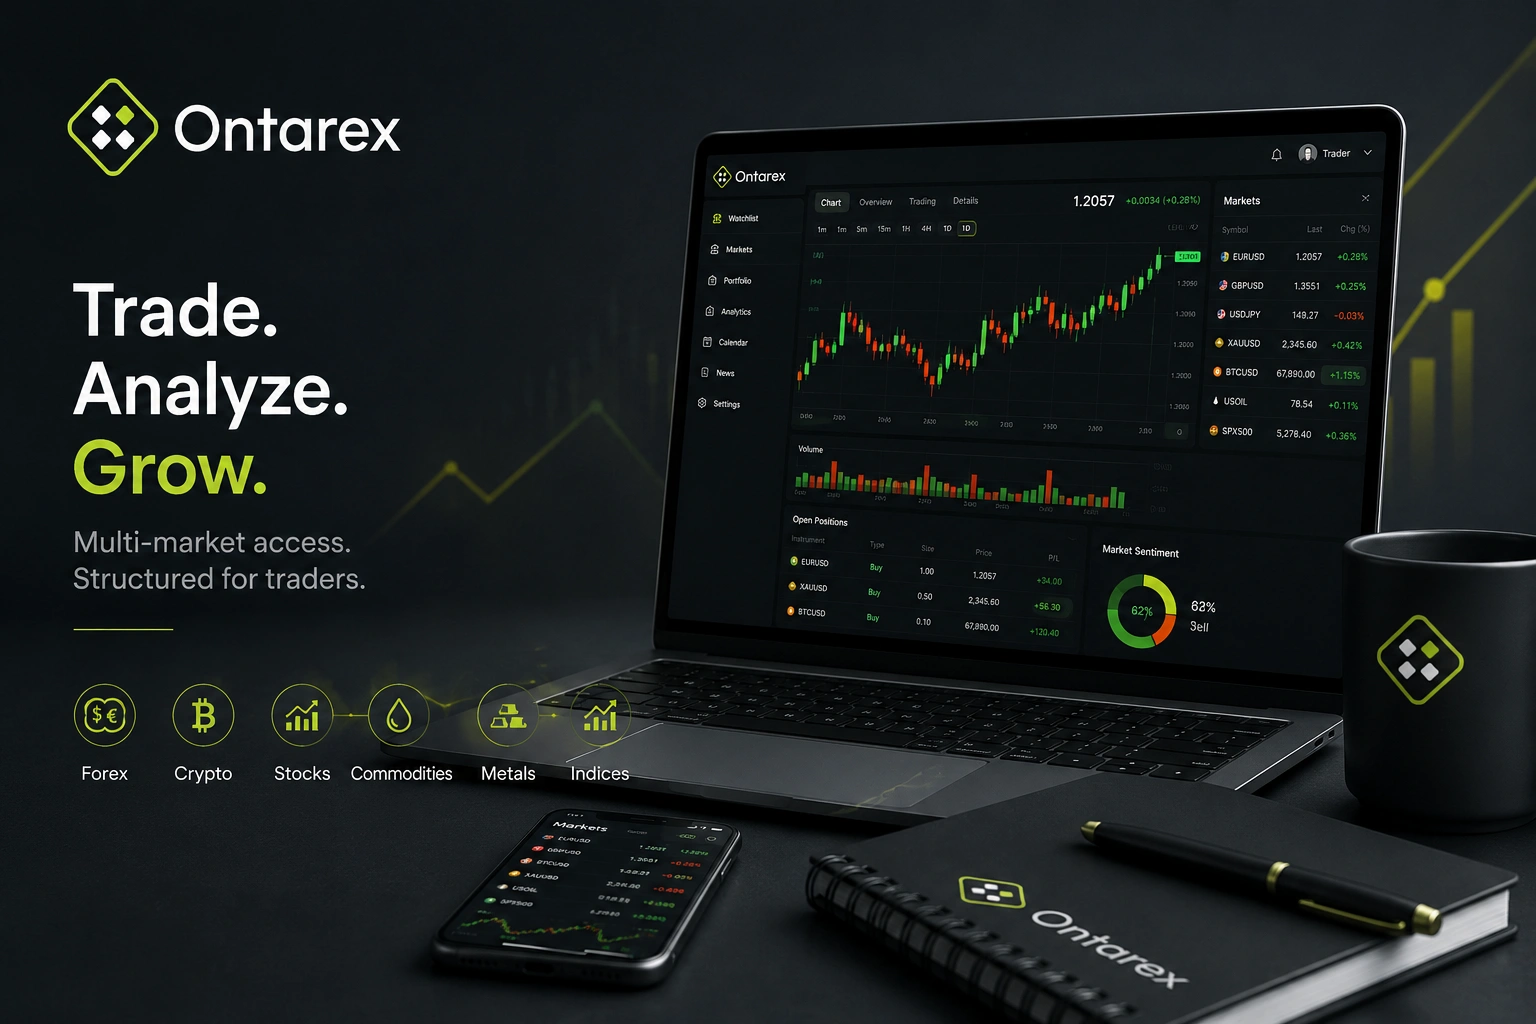
Most modern traders conduct their analysis through our trading platform, where charting systems allow the use of indicators, trend lines, and multiple timeframes while exploring broader trading opportunities.
Several advantages make technical analysis attractive in commodity markets:
- Price charts reveal trends forming over time
- Technical indicators help measure market momentum
- Support and resistance zones highlight potential turning points
- Patterns can appear across many commodity sectors
- Charts provide faster signals than many economic reports
These tools help traders recognize market trend signals that may not yet be obvious through fundamental data.
Note: Technical analysis becomes more reliable when combined with awareness of major economic events.
Core Chart Concepts Used In Commodity Trading
Traders usually begin by studying a few basic elements that appear on most price charts. These concepts form the foundation of technical market analysis.
The following concepts appear frequently when analyzing commodity charts:
- Trend direction shows whether prices are moving upward or downward
- Support levels where buyers previously entered the market
- Resistance levels where selling pressure appeared
- Price momentum indicates how quickly markets are moving
- Volume activity reflecting market participation
Understanding these ideas helps traders interpret price structure behavior and identify areas where new trends might develop.
Tip: Many traders start by identifying the dominant trend before examining smaller chart details.
Indicators Traders Use In Commodity Markets
Indicators transform price data into visual signals that help traders evaluate momentum and trend strength. These tools do not guarantee successful trades, but they can offer additional context when analyzing market conditions.
Below is a comparison of commonly used indicators in commodity trading.
| Indicator | Purpose | Market Signal | Best Timeframe | Typical Commodity Use | Trader Type |
| Moving Average | Identify trend direction | Price above or below average | Medium to long term | Oil and metals | Swing traders |
| RSI | Measure momentum | Overbought or oversold signals | Short to medium | Agricultural markets | Active traders |
| MACD | Detect momentum changes | Line crossover signals | Medium term | Energy commodities | Technical traders |
| Bollinger Bands | Measure volatility | Price expansion or contraction | Short term | Metals markets | Intraday traders |
| Volume Indicator | Confirm participation | Volume spikes during moves | All timeframes | Futures trading | Professional traders |
| Stochastic Oscillator | Momentum timing | Reversal signals | Short term | Commodity futures | Short-term traders |
These indicators assist traders in identifying trend confirmation signals across different commodity sectors.
Alert: Indicators can generate misleading signals during periods of extreme market volatility.
Combining Technical And Fundamental Analysis
While technical analysis focuses on charts, commodities remain heavily influenced by real-world supply conditions. Weather patterns, political events, and economic growth often influence price movement.
Because of this, many traders combine both analytical approaches. For example, a trader might study production reports discussed in supply and demand in commodities analysis while also monitoring chart patterns for entry signals.
Combining both perspectives often produces a more balanced trading approach.
Traders commonly merge these methods by:
- Monitoring supply reports for major commodities
- Confirming trends using chart analysis
- Watching for breakouts near key support or resistance
- Evaluating market sentiment before entering trades
- Using indicators to refine trade timing
This approach encourages balanced market analysis, helping traders interpret both economic data and price behavior.
Warning: Ignoring fundamental events in commodity markets can expose traders to unexpected price swings.
How Traders Develop Commodity Chart Strategies
Developing a strategy usually involves testing different combinations of indicators, timeframes, and chart patterns. Over time, traders refine their approach based on experience and market observation.
Many strategies focus on identifying strong trends first and then entering trades during temporary pullbacks. Traders learning broader commodity markets basics often use this approach to better understand commodity price behavior.
The most effective strategies usually combine clear rules, risk management, and consistent analysis methods.
Conclusion
Understanding commodity technical analysis strategies helps traders interpret market behavior across energy, agricultural, and metals markets. Chart patterns, indicators, and trend analysis provide valuable insight into potential price movement.
While technical tools are powerful, commodity markets are still influenced by real-world supply and demand conditions. Traders who combine chart analysis with fundamental awareness often develop a stronger and more adaptable approach to commodities trading.
Frequently Asked Questions
Technical analysis in commodity trading involves studying price charts, indicators, support and resistance levels, and market trends to evaluate potential price movement in commodities such as oil, gold, or agricultural products.
Technical indicators help traders measure momentum, volatility, and trend strength. Tools such as RSI, MACD, and Moving Averages can provide additional context when analyzing commodity price behavior.
Some traders rely mainly on chart analysis, but commodities are heavily influenced by real-world supply and demand conditions. Combining technical and fundamental analysis often provides a more balanced market perspective.
Technical analysis is widely used across energy markets, precious metals, agricultural commodities, and commodity futures. Traders often apply similar chart concepts across different sectors to identify trends and momentum shifts.